5 ways to use diagrams to visualize your ideas
Brandi Gratis
December 14, 2021
At the beginning stages of any project, brainstorming and organization are important parts of setting your team up for success. One of the best ways to communicate your thoughts to others is to visualize them. Not sure what kind of visual to start with? Here are five ways to visualize your ideas with diagrams.
Mind maps
Mind maps are the perfect brainstorming tool because of their versatility. Basically, a mind map is a web of ideas linking broad categories to smaller subcategories. You can start by throwing everything you can think of onto the canvas. Then, organize the information as you begin to recognize repeated themes and ideas.
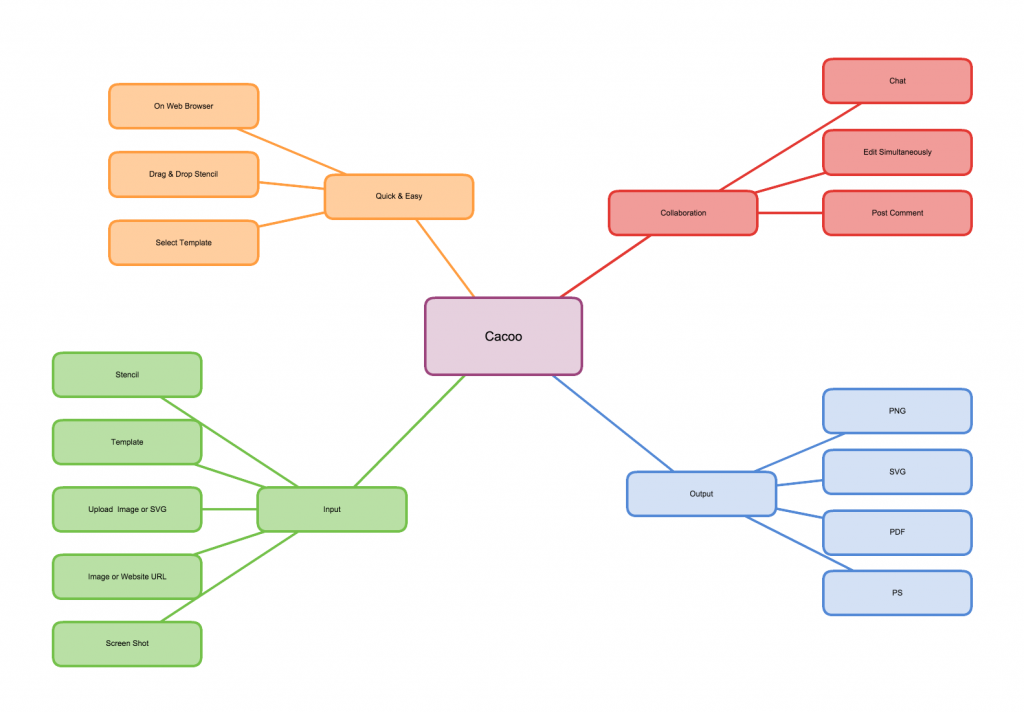
Mind maps assist the brainstorming phase because you can add ideas without a filter. They provide the perfect opportunity to challenge yourself creatively. For one thing, you can put all of your ideas on a visual canvas and spot connections that would be hard to recognize otherwise.
The map format also makes it easy for multiple people to examine and refine the diagram. As you declutter your map, delete ideas that don’t fit or adjust them to fit the themes you identify along the way.
Flowcharts
Flowcharts are the perfect tool for approaching any process-oriented task. These diagrams use simple graphics to represent the beginning, middle, and end stages, following a logical order.
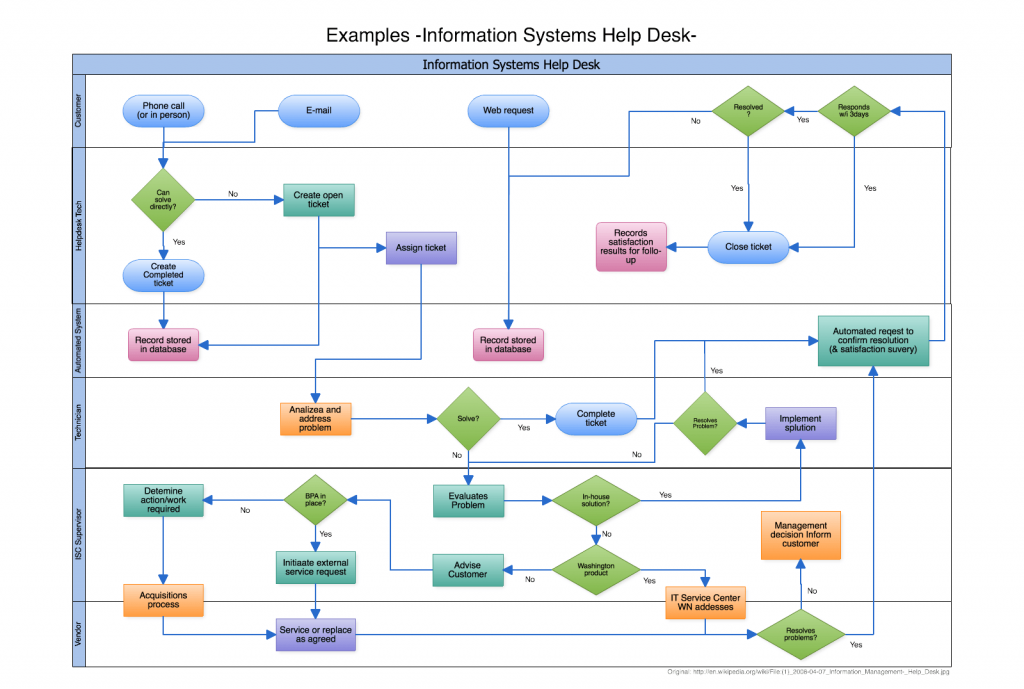
A flowchart can clarify complex ideas in a visually pleasing and easy-to-understand way. Label your beginning and end before approaching each action or decision a person could take along the way. Lay the steps out in the order in which they might occur. That way, any individual who begins the process outlined on your chart will reach the end seamlessly. Try to account for all possibilities in the process, and you won’t be surprised by anything once your strategy is implemented.
Venn diagrams
Venn diagrams help you organize information to better understand the relationship between ideas. You can use them to pinpoint similarities and differences between items.
Venn diagrams consist of overlapping shapes (usually circles). Each circle contains an overarching topic and related ideas. The places where the circles overlap represents an idea that falls under more than one topic.
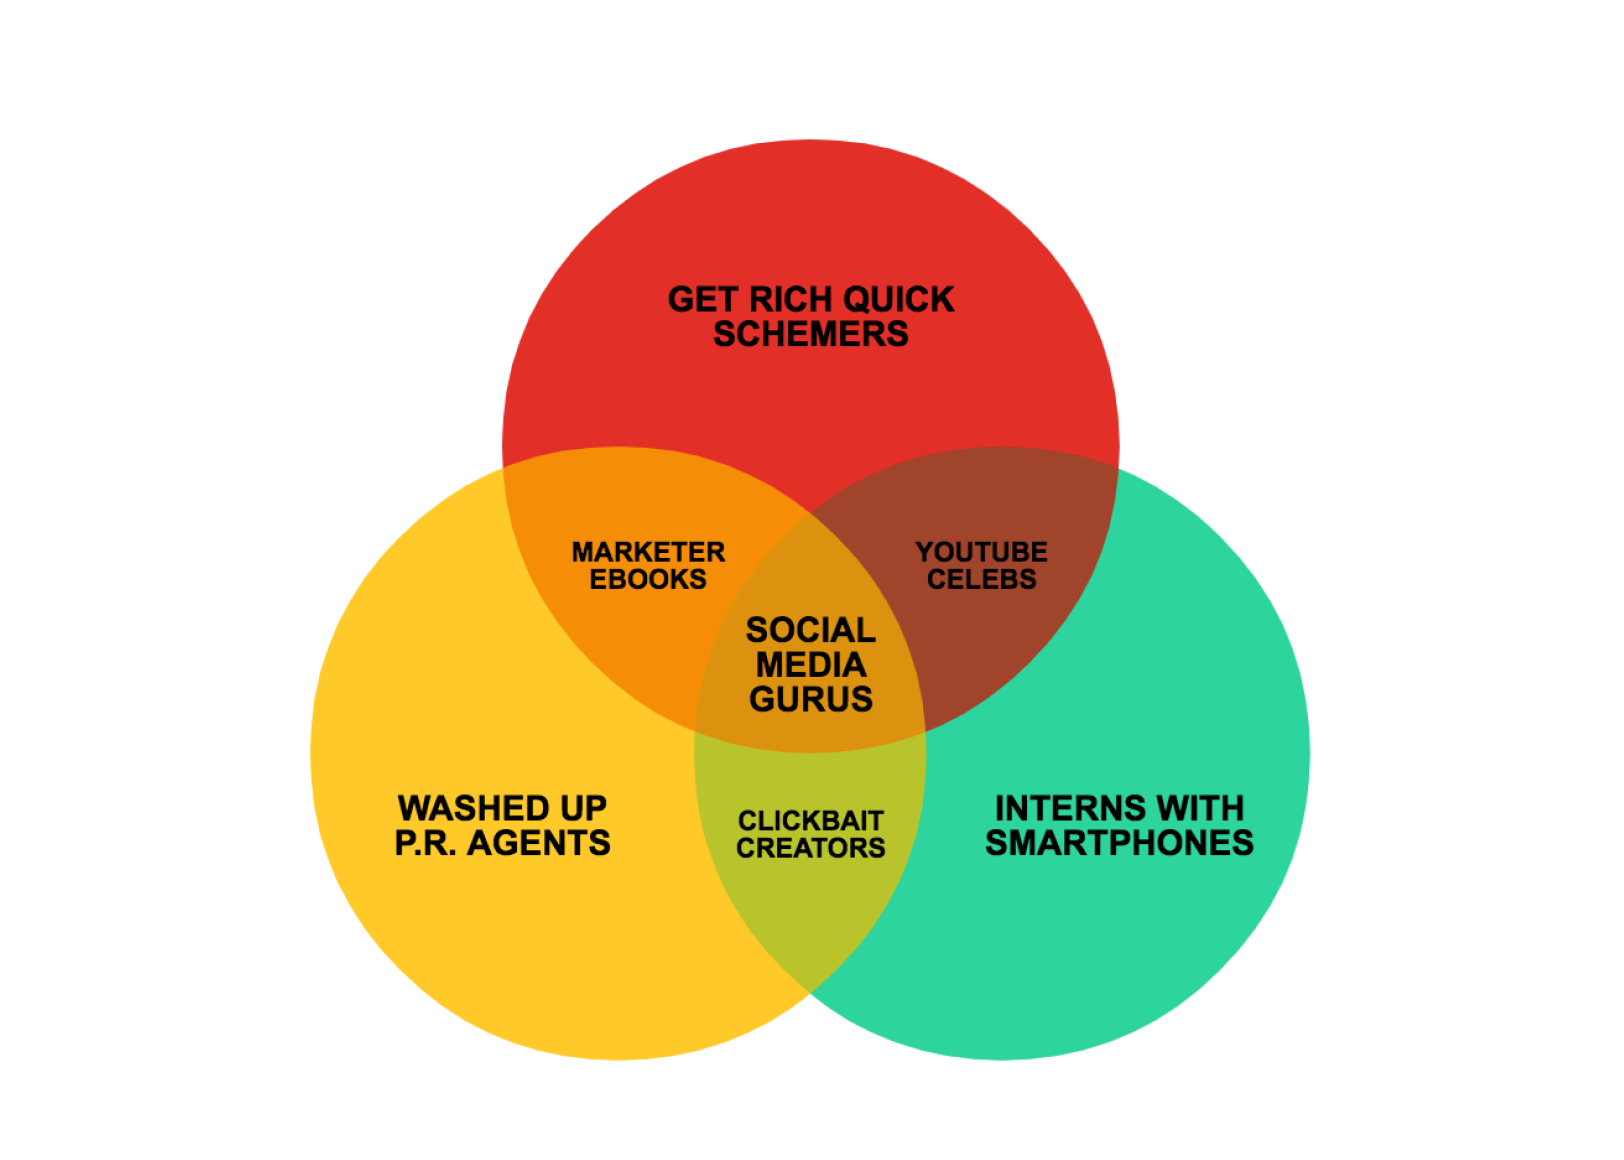
To use a Venn diagram, lay out the ideas you want to compare and contrast in separate circles. Next, list out similarities where the circles overlap, and list out differences where the circles don’t. If the topics you listed all share a common idea, this information belongs in the center where the circles overlap.
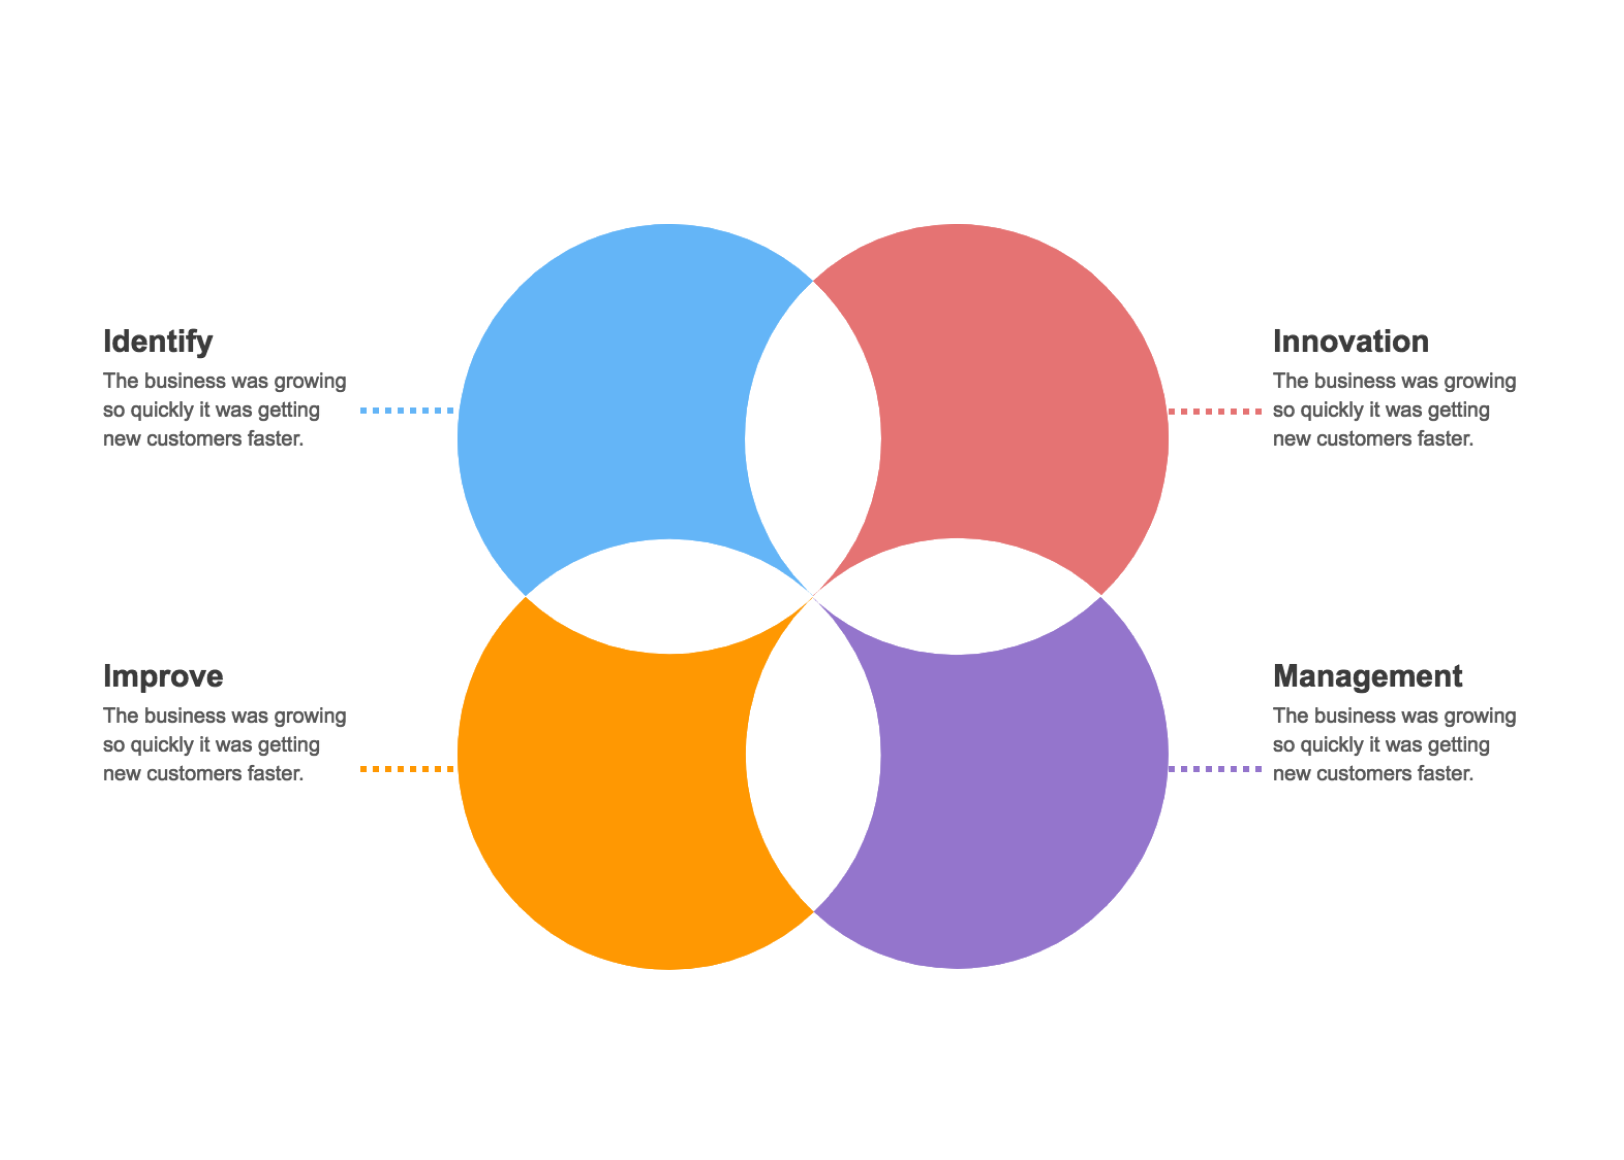
Basic Venn diagrams only contain two circles, but it’s also common to find three- or four-circle formats. Above all, Venn diagrams are best for visualizing simple relationships. Consider choosing a different method for more complex analysis.
SWOT analysis diagrams
A SWOT diagram is used to conduct a business analysis. SWOT is an acronym that stands for strengths, weaknesses, opportunities, and threats. The business planning stages are more structured and productive if you evaluate these four elements before making big decisions.
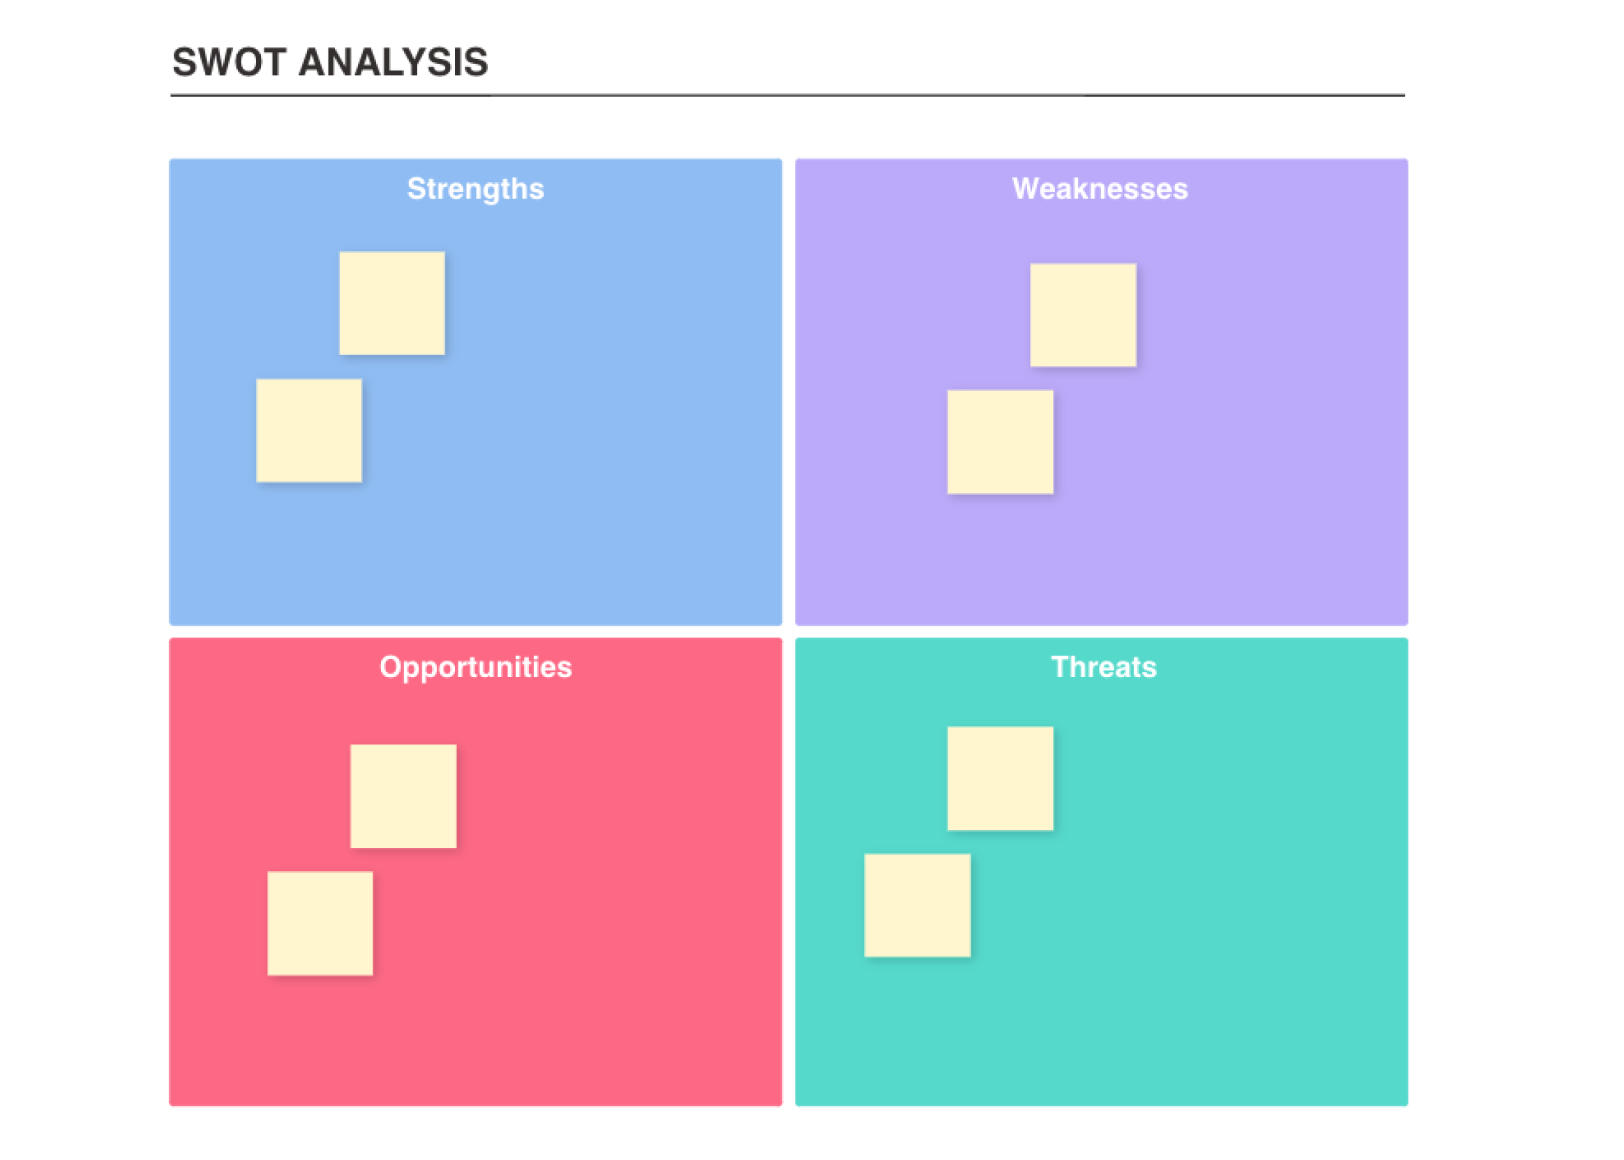
A SWOT analysis is ideal for identifying the right goals to prioritize in a business or project. Why? The grid allows you to compare internal and external factors that could influence your business decisions. By comparing the four SWOT analysis factors, you can develop a strategy to reduce threats and maximize opportunities.
Project timelines
For many of us, adding tasks to a calendar isn’t enough to promote personal accountability. Creating a project timeline you can refer to throughout the week helps to improve time management.
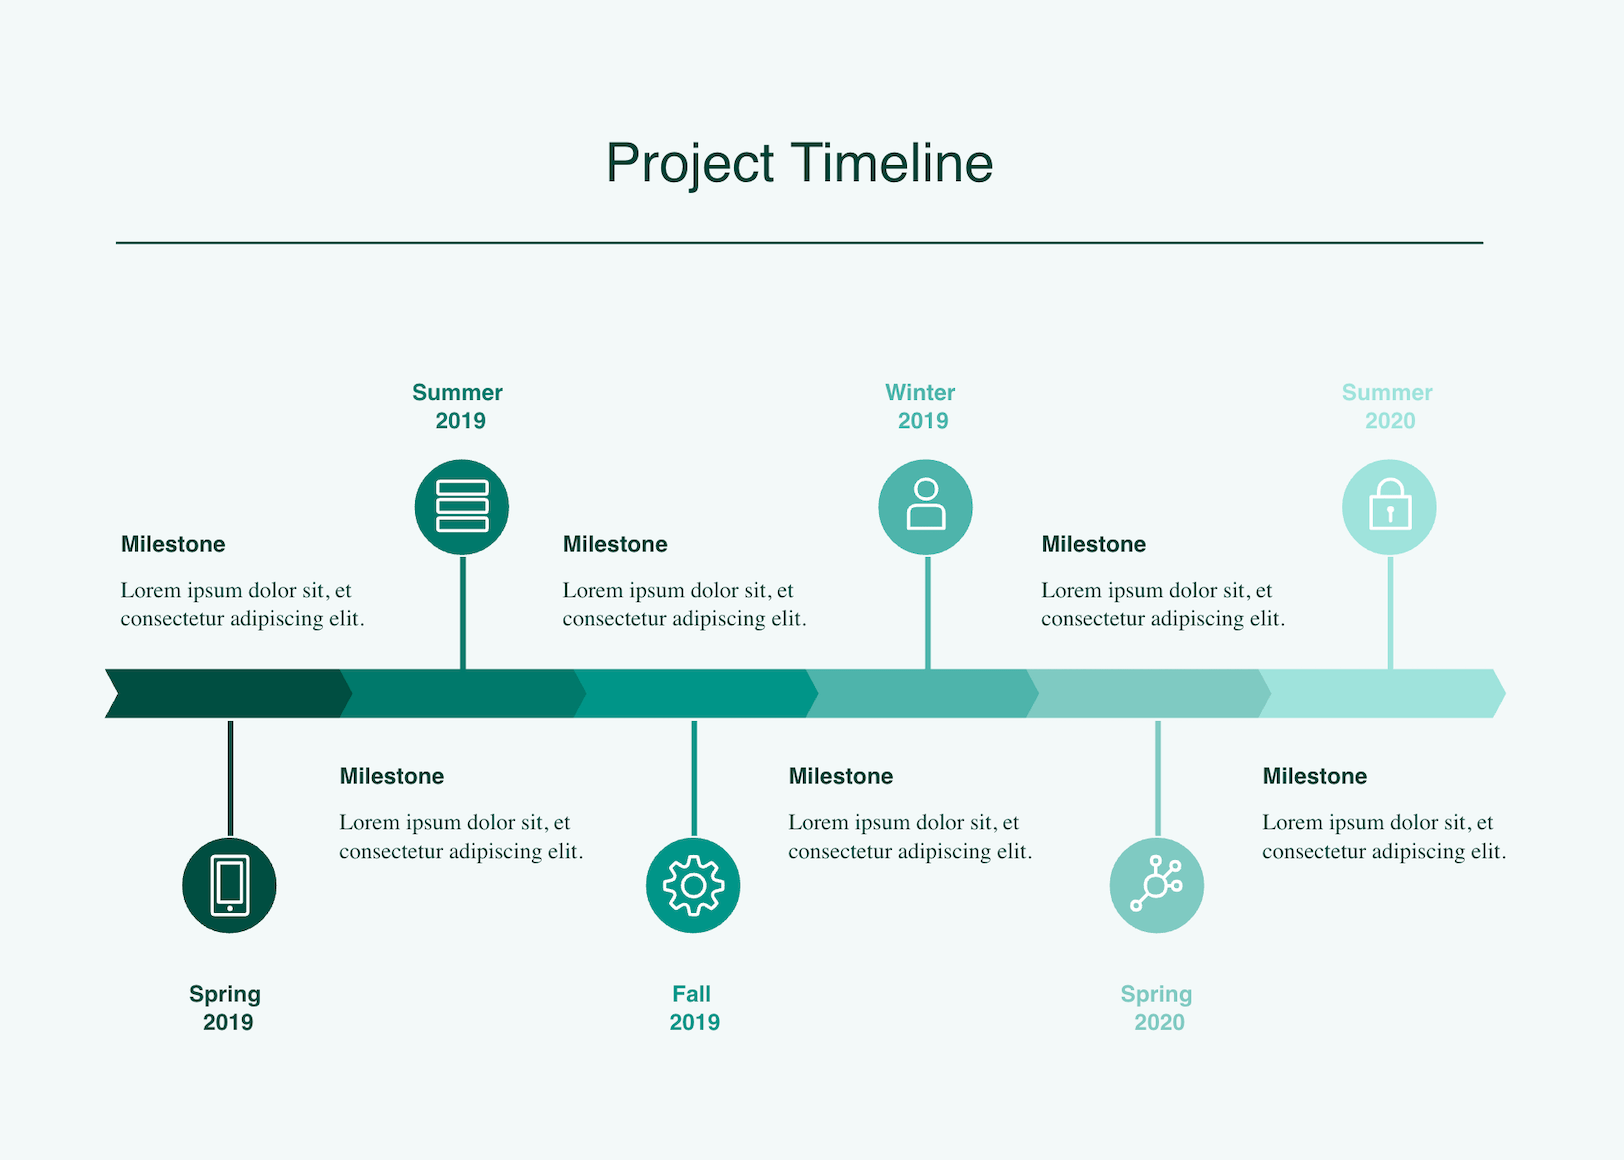
A project timeline is a visual layout of the phases and milestones in a project. It can consist of a single-path timeline or a more complex layout with overlapping milestones. In both cases, the timeline provides a visual reminder of team progress. You better understand how you need to schedule tasks to fit within each phase.
Final thoughts
Getting your thoughts organized is often one of the most difficult parts of starting a new project. Fortunately, there are lots of diagrams available to facilitate this process. Cacoo is a beneficial tool for diagramming and collaborating with others. Work from professional templates, or use the shapes and design tools to create stunning diagrams one element at a time.
This post was originally published on October 24, 2016, and updated most recently on December 14, 2021.

![[Flowchart] What New Year’s resolution should you make?](https://cdn.nulab.com/learn-wp/app/uploads/2021/01/14211608/new-years-resolution-blog-cacoo-2021.png)