Funny Venn diagrams to inspire you

Georgina Guthrie
September 08, 2021
Venn diagrams are a simple way to show links and differences between two or more sets of data — whether that be an idea, a role, a person, or… well, anything, really… as you’ll soon see.
They’re commonly used in mathematics and other data-heavy subjects, but they’ve more recently been hijacked and turned into something of a tool for funny comparisons for all kinds of life situations.
The good news is, Venn diagrams are really easy to create — so if you want to try making some yourself, we’ll tell you exactly how to do it. Let’s get into it!
What is a Venn diagram, and where did they come from?
First, a quick history lesson. Venn diagrams (aka primary diagrams, set diagrams, or logic diagrams) are diagrams that show the logical link between sets.
Created by John Venn in the 1880s, they were originally used to teach set theory and show relationships between probability, logic, statistics, linguistics, and computer science.
Essentially, a Venn diagram is a diagram that uses simple circles, ellipses, or closed curved shapes to represent sets.
10 funny Venn diagram examples (plus a bonus Venn diagram fail)
The word ‘diagram’ might conjure up images of flowcharts and other process-driven work creations. But, like all diagrams (including flowcharts), the humble Venn can be subverted for comedic purposes. So without further ado, here are some of our favorites to bring a smile to your face.
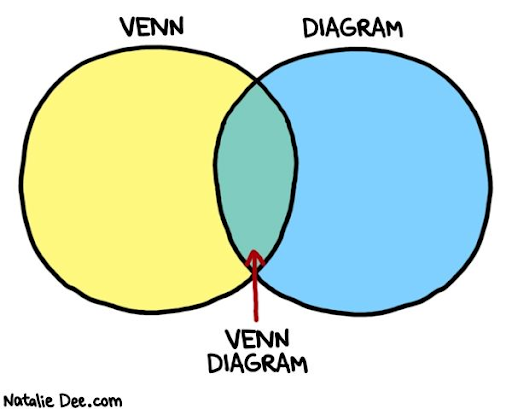
1. The ‘an introduction to Venn diagrams’ Venn diagram
First, here’s a Venn diagram to help us unpack the name, which (as this diagram helpfully illustrates) is made up of the words ‘Venn’ and ‘diagram.’
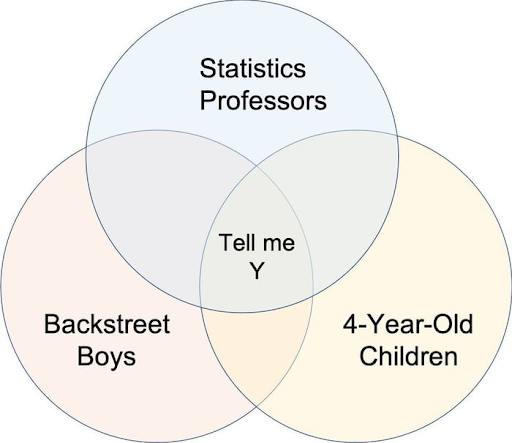
2. The ‘tell me Y’ Venn diagram
An all-time favorite. Consisting of three simple circles, this example shows the intersection between statistics professors, four-year-old children, and The Backstreet Boys — three distinct groups that, at first glance, appear to have very little in common, save for one thing…
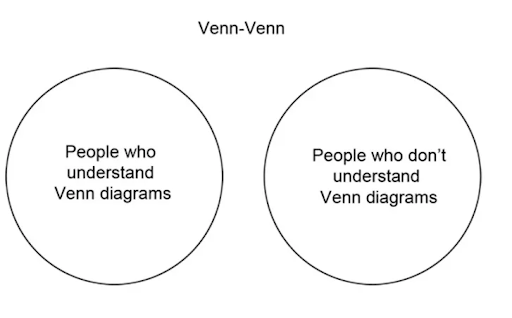
3. The ‘no-relation’ Venn diagram
Not all Venn diagrams need to show a crossover between two sets of things. Sometimes they’re mutually exclusive, as the example below shows.
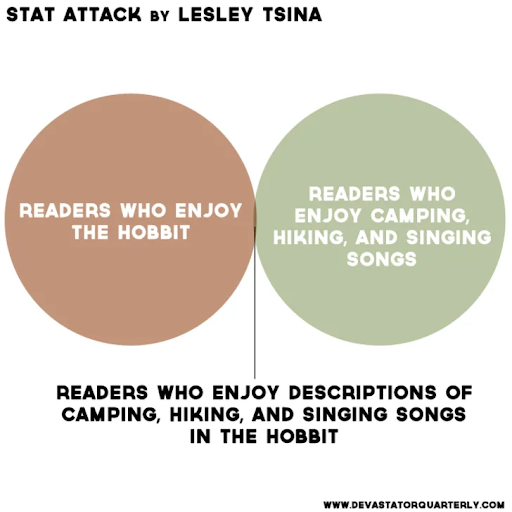
4. The ‘barely-related’ Venn diagram
Sometimes things make sense on paper, but the reality… not such a happy marriage. The Venn diagram below shows how two sets of people that seem like they’d be a match made in heaven really have far less in common than initially thought. (For those unacquainted with The Hobbit, it features a lot of hiking, camping, and singing songs.)
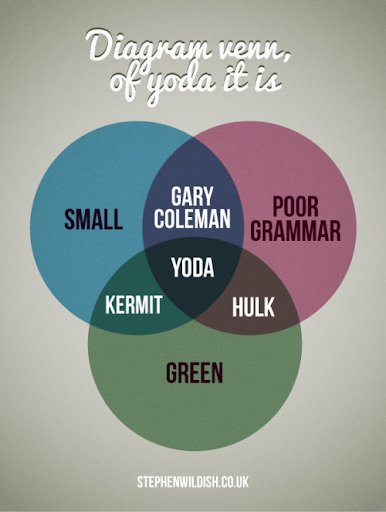
5. The three-way Venn diagram
Venn diagrams don’t need to be limited to two items — as you’ll see in the example below. Here, three circles show a more complex series of intersections: adding one extra circle has allowed four crossovers, with one small, green, grammar-inept creature being the uniting… force (sorry).
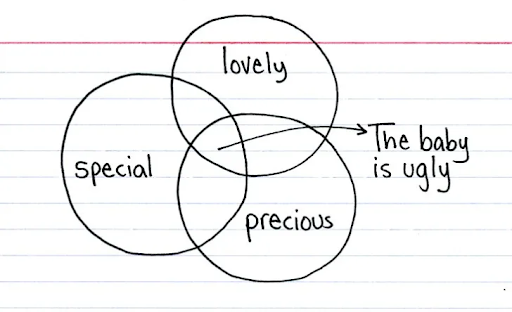
6. The ‘euphemism’ Venn diagram
It’s not always easy to know what people really mean — but with this handy Venn diagram, you can read between the lines. Brutal, yet useful.
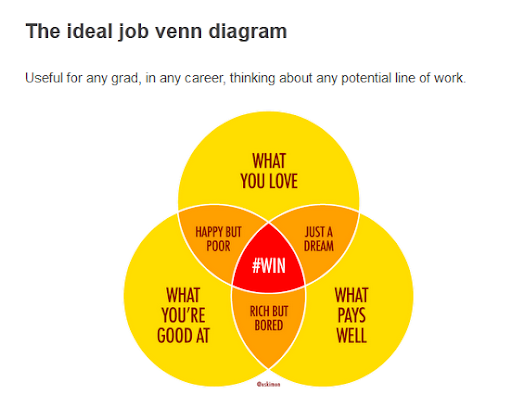
7. The ‘how to win at work’ Venn diagram
Did we mention Venn diagrams can be funny AND inspiring? This diagram is a brilliant way to help you figure out your passion and how to make that into a lucrative career.
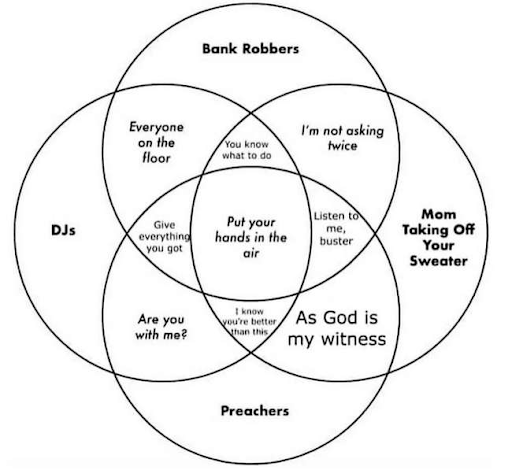
8. The ‘it’s all in the delivery’ Venn diagram
This four-set Venn diagram is a perfect way to bring the phrase “it’s not what you say, it’s how you say it” to life. Here are four seemingly unrelated sets with more things in common than meets the eye. Note how adding another circle more than doubles the number of intersections. One, four, nine…
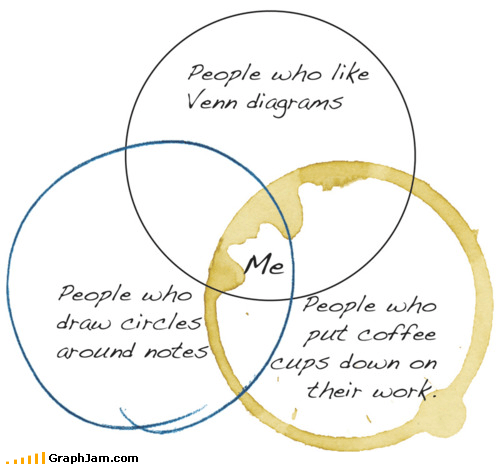
9. The ‘self-aware’ Venn diagram
Can you make Venn diagrams about Venn diagrams? Of course you can! The example below proves it. Bonus points to the creator here for using an actual coffee cup ring stain to represent one of the circles.
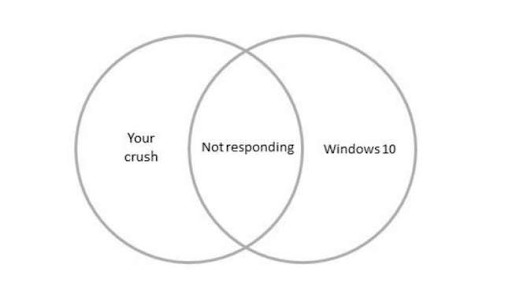
10. The ‘laugh at a bad situation’ Venn diagram
There are few things more frustrating than tech not doing what it’s supposed to do. So how do you deal with all that pent-up irritation? Let loose with a snarky Venn diagram, of course.
Ideal for work situations, they’re a great way to let off steam and put a smile on your colleagues’ faces. Dodgy printers, overly complicated processes, and demanding clients are all ripe for ridicule here.
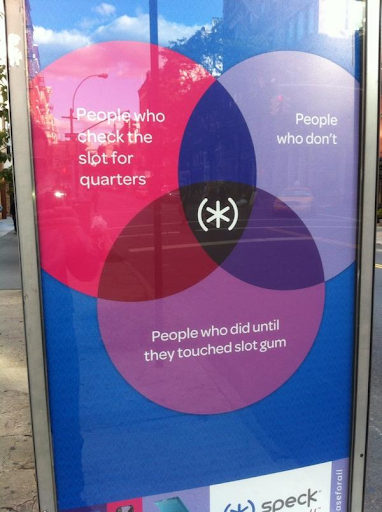
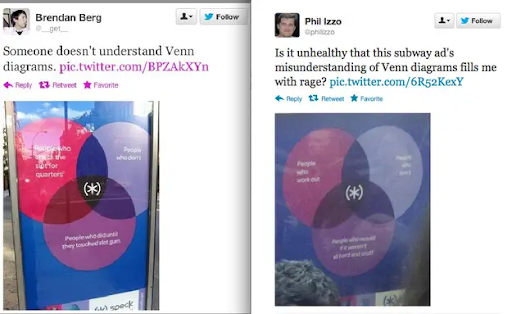
11. The failed Venn diagram
If you’re going to make a Venn diagram, at least learn the basics. These Venns that popped up all over NYC by smartphone case manufacturer Speck sadly didn’t make the grade. Why? Because people who check the slot for quarters and people who don’t are mutually exclusive sets — so there shouldn’t be a crossover (we refer you to fig. 2: the no-relation Venn). Just… no.
The company’s response:
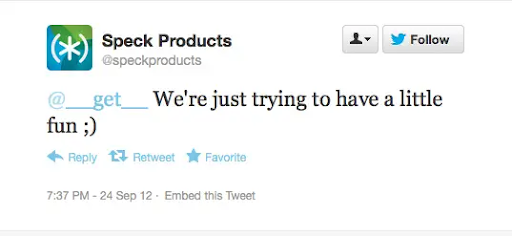
OK, so they may have failed at Venn diagrams, but they won at free publicity: Irritated New Yorkers were vocal about their feelings, meaning Speck’s name was splashed all over Twitter.
Final thoughts
Venn diagrams are an easy way to show relationships (or lack of) between two or more different sets. Not only are they simple to understand — they’re fun and straightforward to create, especially when you use a diagramming tool.
Cacoo’s diagram tool is an easy way to make a Venn diagram online.
Simply choose your template (it’s free!), then edit it by dragging and dropping shapes, words, images, and colors onto your canvas. With loads of design tools to choose from, it’s simple to customize the way it looks. Plus, because it’s online, you can invite other team members in to add comments, share, view, or edit at any time.
![[Flowchart] What language should you learn this year?](https://cdn.nulab.com/learn-wp/app/uploads/2020/11/14211529/blog.png)
